Flying Insect Sampling at the Acopian Center
Posted on in In the Field by Alexandra Hagans

In May, the Hawk Mountain Sanctuary Conservation Science team began participating in the Malaise Trap Project, a collaborative monitoring effort by the North American Insect Abundance Network dedicated to tracking flying insect abundance across Canada and the US. The University of Colorado Colorado Springs (UCCS), along with about 80 researchers across the continent, have gathered samples from Malaise-style traps starting in 2023 and will continue to 2025. A similar study using Malaise traps conducted in Germany by Hallmann et al. 2017 estimated a seasonal decline of 76% in flying insect biomass, and a mid-summer decline of 82%. Loss of insect biodiversity is expected to create cascading effects on ecosystems and cause declines in species that depend on insects as a food source. This data collected from this project will be used to study the effect of insect abundance on the reproduction of swallows. Some raptors, such as kestrels and screech-owls, feed on insects regularly in summer months. Other raptors feed on birds or mammals that feed on insects, so understanding insect declines is important to raptor conservation.
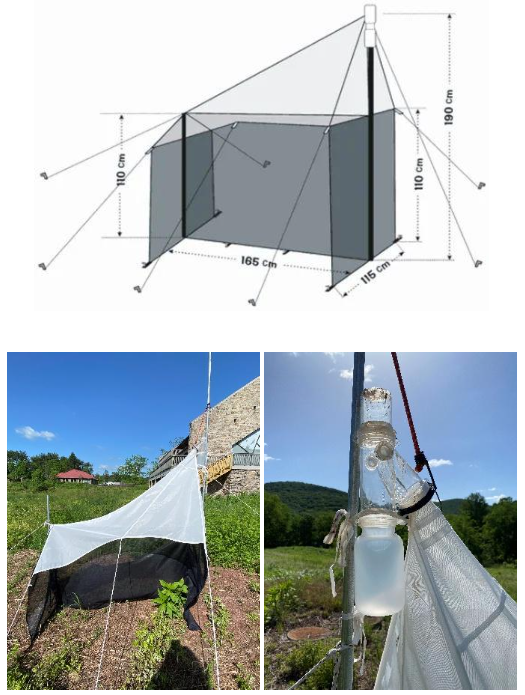
The protocol for this project is based on the methodology of Dunn et al. (2023) with some modifications to simplify the protocol. The Malaise-style trap is designed to capture flying insects common in fields or grassy areas. The trap is oriented North-South to intercept prevailing winds and increase likelihood of flying insects entering the trap. The trap is designed to encourage insects to move upwards, flying against the inner middle net panel and traveling upwards towards the cone-like head of the trap and into a collection bottle containing 70% denatured ethanol.
Three insect samples were taken from the Malaise trap placed at Hawk Mountain Acopian Center this spring and collected over a period of 72 hours. The start date of the first sampling period is determined with a formula that uses the coordinates and elevation of the trap site to calculate the average laying date for tree swallows in the region. The average laying date using the location data from the Acopian Center was calculated to be May 17, however our first sampling period was changed to May 18 for logistical reasons. The trap ran from 10 am on May 18 to 10 am on May 21, after which the collection bottle was removed, and the insects inside were sorted.

The start dates for the remaining two sampling periods were determined simply by adding days to the start of the first and second samples. These two dates correspond to tree swallow average hatch date and the day by which nestlings should be twelve days old respectively. The next sample started on June 6 at 10 am and ended at the same time on June 9. The third and final sample was timed for when the nestlings would be twelve days old on June 18 and end on June 21 at 10 am.
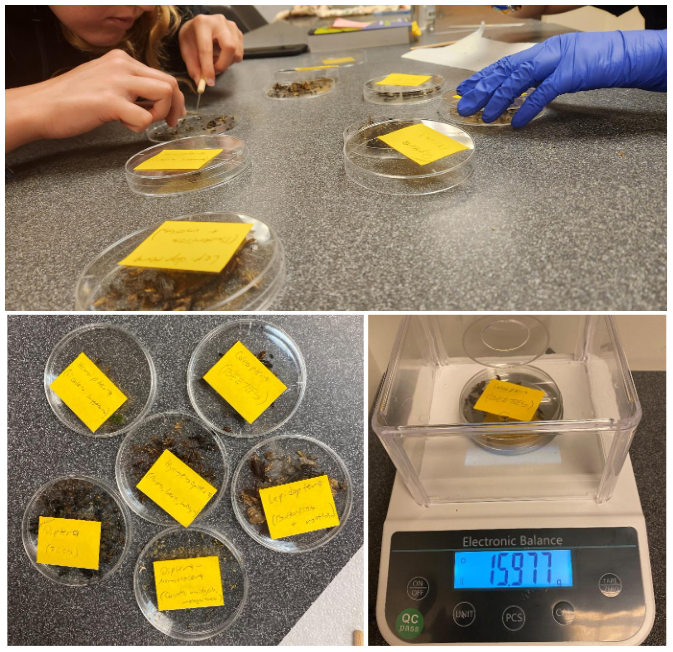
Collected insects were sorted at the end of each sampling period. At 10 am on the last day of each sampling period, the ethanol collection bottle was removed and the contents poured through a kitchen strainer and held until the time between drips exceeded ten seconds, which was shortly after the initial pouring. The strained insects were then placed in a petri dish and weighed to get a total mass for the sample. The insects were sorted into five orders (and one subgroup) and placed into dedicated corresponding petri dishes. Sorting was limited to one hour to prevent the ethanol from evaporating and the insects drying out. At the end of the sorting period, the mass of each individual order was taken and recorded. Following this, the insects were placed into labeled bags and refrigerated for long-term storage.
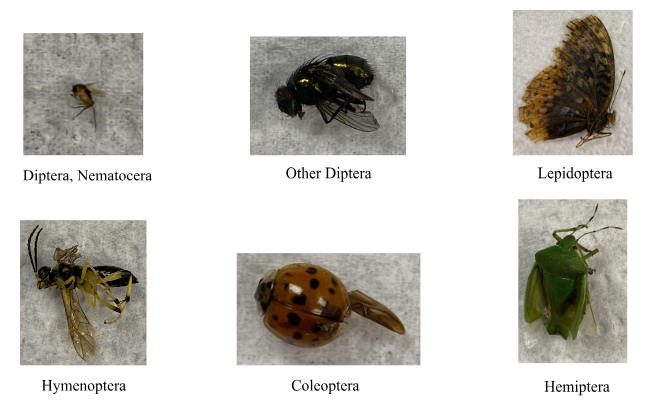
The six groups sorted were Diptera, Nematocera (Gnats, midges, and mosquitoes), Other Diptera (Flies), Lepidoptera (Butterflies and moths), Hymenoptera (Bees, wasps, and ants), Coleoptera (Beetles), Hemiptera (Hoppers, cicadas, and shield bugs).
The total mass taken from sample 1 was 9.536 g, 10.401 g from sample 2, and 12.879 g from sample 3 for a total of 32.816 g of insects collected. The total mass of insects collected increased by 9% and 24% for samples two and three, respectively. The largest group sorted in samples one and two was Diptera (Flies), but the largest group for the third sample was Lepidoptera due to more butterflies and moths emerging later in the Spring. All order masses increased in sample 3 except Coleoptera and Other Diptera which decreased slightly.
The percentages of each order represented in the 32.816 g total insects collected are Diptera, Nematocera- 6%, Other Diptera- 25%, Lepidoptera- 17%, Hymenoptera- 18%, Coleoptera- 7%, and Hemiptera- 3%. The largest order collected was Other Diptera with a quarter of all insects sampled coming from this order.
The data collected from this project was entered and shared electronically using Google Sheets and will be used to study the impact of insect abundance on swallow reproduction.
Prior to participating in the Malaise Trap Project, I had very limited experience with insects and I had never sorted orders before. Sorting the first sample was very overwhelming because I hadn’t yet formed solid search images in my mind for the different insects and their orders. The first sorting session went over the 1-hour time limit because I was fixing my mistakes and learning as I went, leading to me having to rewet the insects with ethanol. However, after this rocky start, I found that I learned from my mistakes and the remaining sorting sessions went much easier and quicker. I am grateful to have had the opportunity to participate in this study and learn skills that I otherwise would not likely have developed.
References
Dunn, Peter O., Insiyaa Ahmed, Elise Armstrong, Natasha Barlow, Malcolm A. Barnard, Marc Bélisle, Thomas J. Benson, et al. “Extensive Regional Variation in the Phenology of Insects and Their Response to Temperature across North America.” Ecology 104, no. 5 (May 2023): e4036. https://doi.org/10.1002/ecy.4036.
Hallmann, Caspar A., Martin Sorg, Eelke Jongejans, Henk Siepel, Nick Hofland, Heinz Schwan, Werner Stenmans, et al. “More than 75 Percent Decline over 27 Years in Total Flying Insect Biomass in Protected Areas.” Edited by Eric Gordon Lamb. PLOS ONE 12, no. 10 (October 18, 2017): e0185809. https://doi.org/10.1371/journal.pone.0185809.

